
Ever been part of teams where you add in features because the senior person in the team says so but user feedback says otherwise? Or the opposite, where someone thinks a certain feature would work in the product and everyone agrees but it doesn’t get shipped because there’s not enough time? If you are looking at ways to quantify and prioritize product features and optimize the development pipeline, the Kano model is a good model for you. It uses customer satisfaction as a criteria rather than cost-revenue, roi etc and can be used when the product focus is retention.
This model was created by a Japanese professor called Noriaki Kano in the 80s and is still relevant today to remain competitive. It is simple, easy to understand and effective. It has 5 different types of features and two buckets.
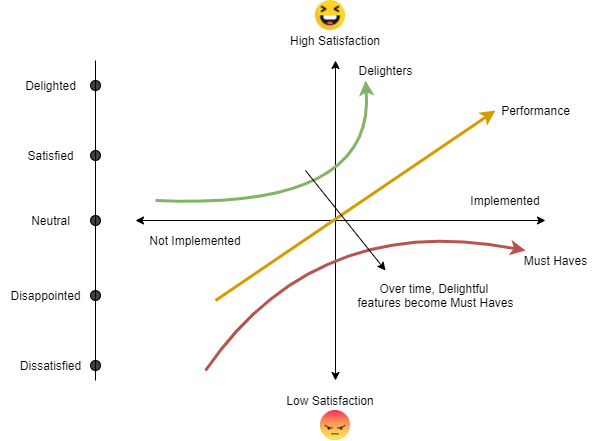
Features to Add
Delightful
Neutral
Satisfactory
Features to Avoid
Disappointing
Dissatisfactory
You would want to keep ‘features to avoid’ out of the roadmap and focus on the ones which result in maximum customer satisfaction to arrive at a ‘WOW’ product that your users like. Instead of asking in a questionnaire format, show a glimpse of the feature either as a png/jpg image or a animated gif. Then ask a functional + dysfunctional question for the feature and map it on an evaluation matrix.
E.g: Suppose you are coming out with a new phone model and you want to know if the time and financial resources to put in wifi connectivity is worth it.
Functional question: If your phone has strong wifi connectivity, how do you feel?
Dysfunctional question: If your phone has a weak or non-existent wifi connectivity, how do you feel?
User input to both questions is a rating from 1 (like) – 5 (dislike). This can be in the form of a user survey after you demo a certain feature.

| 1 | I like it |
| 2 | I am expecting it (must have) |
| 3 | I am neutral |
| 4 | I can tolerate it |
| 5 | I hate it |
You are going to end up with a bunch of values like the ones below. Map them as shown in the grid below, where functional scores are rows and dysfunctional scores are columns.
Functional = [5,4,5,3,5,2,3,1,3,1,5,3,4,4,3,5,5,3,5,4,3]
Dysfunctional = [2,1,3,1,1,4,2,3,2,1,2,2,2,1,1,3,2,1,4,3,1,2]

| A | Attractive feature |
| M | Must Have feature |
| I | Indifferent (Neutral) feature |
| R | Reverse feature |
| Q | Questionable response |
The Reverse ‘R’ means that if you reverse the response with questions, you will be able to see which bucket the feature falls into. Questionable ‘Q’ means that the user has given contradictory responses to the questions e.g. if user say ‘i like it’ for both functional and dysfunctional questions. This case can safely be ignored. Other mappings are self explanatory.
Customer satisfaction is the most important criteria for product success. Users will come back and your retention numbers will increase only if users actually like using your product. This model gives a form / structure to a complex decision making process and to a certain extent, organizes the process of prioritizing product features which can then be weighed on a cost / ROI scale to help make better decisions.
Leave a Reply