
Your magical product app is released and real people are starting to use it. It feels rewarding to see traffic, much more to look at revenue numbers go up. There needs to be a way for you to quantify the app in order to sustain and grow the product. This is where monitoring metrics work wonders.
Product Stability and Performance: This is the fundamental on which everything else is built upon. As long as these metrics are as per your benchmark, everything else can be worked upon. If these metrics don’t add up, then the engineering team would need to work towards resolving issues, rearchitecting code blocks etc until the app is stable and healthy.
Concurrent Users (CCU): The number of users which can simultaneously use your app without a drop in performance. The more the number, the larger the audience that your marketing team can reach out to and ultimately earn from.
Mean time between failures (MTBF): The average time between two failures. This gives a good estimate of the overall product stability.
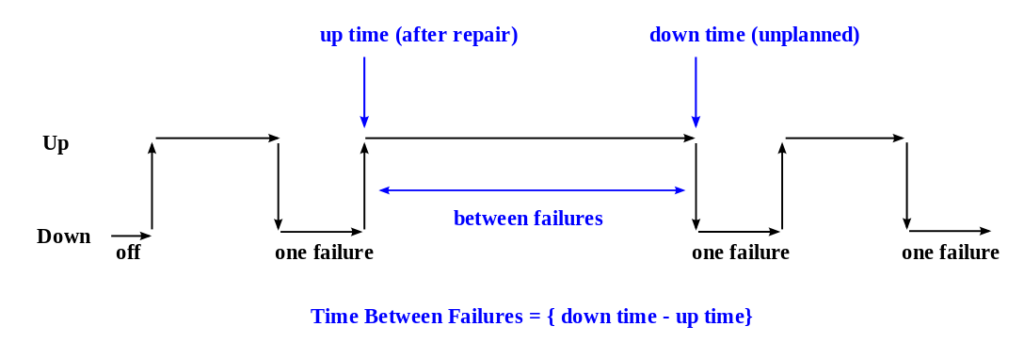

Mean time to recover/repair (MTTR): The average time taken to bring the system back to normalcy after a failure event. This helps with understanding the responsiveness of the maintenance team.
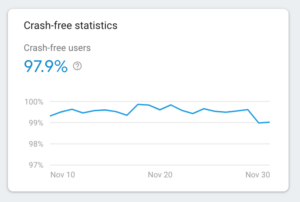
Crash Free Users: The percentage (%) of your active users who have not faced a crash event in a given version of your app. This helps to decide if an app update is stable enough for the end user.
Average Response Time (Web APIs): This value should tend towards 0 ideally. The lower the number, faster your app. The higher the number, the more your app begins to feel sluggish and slow, deteriorating the user experience.
Peak CPU Utilization / Peak Concurrent Users: This is a measure of system performance. This shows how many users a server instance can handle.
Peak Memory Usage / Peak Concurrent Users: This is a another measure of system performance. This shows how many users a server instance can handle without running out of memory.
Avg incidents per week / month: Keeps track of the number of failure events in a given span of time.
User Acquisition: Product needs a good acquisition strategy and successful campaigns to get users and onboard them. You would need to actively monitor these metrics to see if you are able to achieve your acquisition goals.
Traffic (Paid / Organic): In offline businesses, this is the number of footfalls that a shop generates. Thankfully we can actually measure incoming traffic objectively for online products.
Customer Acquisition Cost (CAC): This is the cost spent on acquiring a customer. You can arrive at this by dividing your acquisition expense by the number of users acquired. You can do it seperately for each acquisition channel to see which one delivers the most value.
Click Through Rate (CTR): This is the number of clicks your ad received divided by the number of times the ad is shown. You can calculate it like so: CTR = (Clicks / Impressions) * 100. This measures the effectiveness of your ad campaigns.
K-Factor: The virality co-efficient is the measure of how viral your product is. A virality value less than 1 means product virality is on the downward trend. A virality value greater than 1 means people are sharing the product with other people which acts as a good acquisition channel. A value of 1 means sharing has not increased, neither decreased. The higher this number, the more organic traffic increases for your product and your acquisition expense gets reduced.

Retention Metrics: You have a product and have a consistent acquisition strategy. How do you plan to make the users stay and use your product for a long time?
Active Users: DAU (Daily Active Users) and MAU (Monthly Active Users) are the two metrics that you need to look at. These are users who are consistently coming back to your product. Any drop off in the active users trend should trigger a thorough evaluation of the cause.

Average Session Duration: The average length of user sessions. Higher the number, the more engaged is the user.
Retention Rate: This seems like a more positive way of looking at user churn. This tells us how many users are coming back to the app. It is usually measured in ‘N’ day intervals. D1, D7 and D30 for which good numbers are somewhere around 40%, 20%, 10% respectively.
Feature Usage (%): The percentage of active users who are using a particular feature. E.g. ~30% of active users use the chat feature.
Average Customer LifeTime: The number of days on an average that a users uses your product. For an app, thats the total duration between install and uninstall.
Net Promoter Score (NPS): This tells us if users think highly enough of your product to share it with their friends, family or colleagues.

Monetization Metrics: You made it this far. You have a stable product. Users are flocking to your app and using it every day. Now might be a good time to start monitoring your inflow.
Average Revenue per User (ARPU): This is the unity revenue for a given time duration. E.g: The monthly ARPU can be arrive by dividing the monthly revenue by the number of users. A good metric to plan future projections as well.

Monthly Recurring Revenue (MRR): This gives a predictability to the revenue numbers. To calculate MRR, simply multiply the number of paying users with the ARPU i.e. MRR = ARPU * No. of Paying Users for the month.
Life Time Value (LTV): On an average how much revenue can a user generate for your product. This is average customer spend over their entire lifetime duration with your product.
CAC : LTV: The golden metric. Keep a close eye on this one. If you goal is profitability, this ratio should always tend towards 0. If this goes beyond 1, you are spending more than you are receiving and should optimize to make sure you are profitable.

Leave a Reply