Why use RFM Segmentation
RFM analysis is one of the easiest to learn that will help you predict the future behaviour of your customers. But tools like Mixpanel and Clevertap are quite expensive for a startup or a small sized busines. They miss out on this crucial part of customer analysis which I feel holds them back. If they learnt how to segment manually, they could either perform the process below and reap rich rewards. Or build a software in-house with automated segmentation and reports. Either way, founders of startups and small businesses should definitely learn RFM segmentation and accelerate their business growth.
In this post, let’s learn the answer to some of the most pertinent questions that come to mind when managing any online or offline business:
Which customers contribute the most to revenue?
Which customers will contribute to revenue in future?
Which customers are the most loyal?
Which customers spread the brand and help acquire new customers?
How many customers did we lose?
How many customers can we bring back?
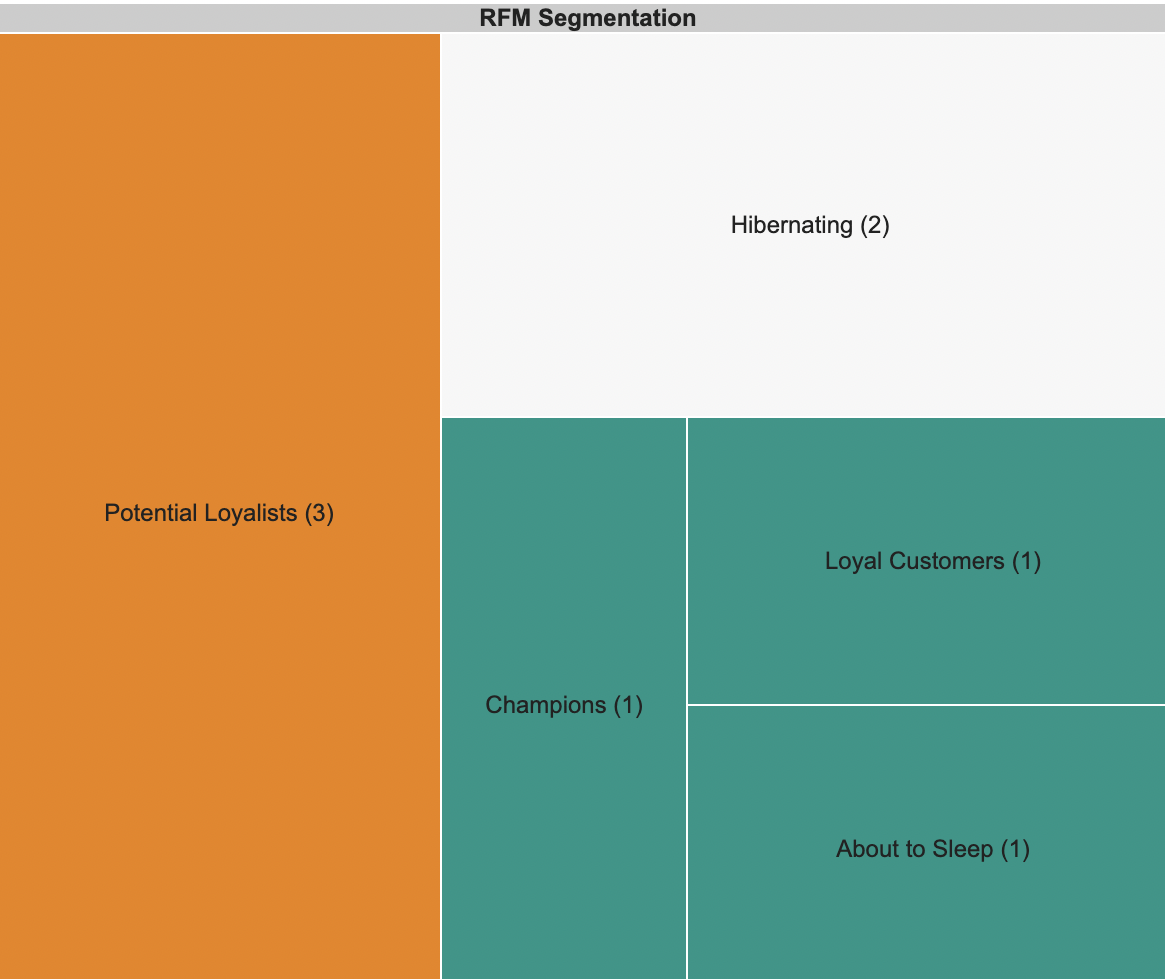
RFM analysis will help find answers to these questions and more. Let’s find out how to perform RFM segmentation on a sample data size of 8 without using enterprise paid tools. You can apply whatever data size you want. Learn how to create the above Treemap chart and start using RFM in your production data. The best part, you can do this even if you don’t have access to expensive tools like Mixpanel or Clevertap. Excel is the only tool that we are going to use. Let’s start!
Step 1: User Data
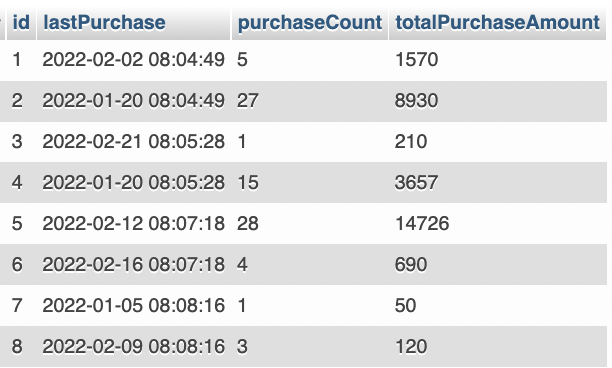
You need to have data like the example below. In case of multiple tables, aggregate the data to the format shown below. This is the start of something exciting!
Step 2: RFM Values
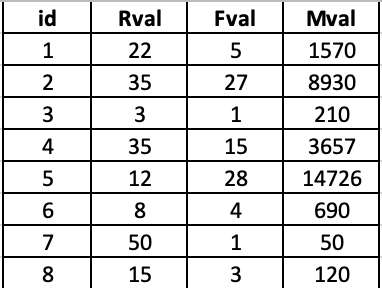
Let’s export the above data in a CSV / Excel format. Now that we have this data in excel, let’s calculate the individual R,F and M scores.
Rval (Recency): Deduct lastPurchase date from today to get how many days it has been since last monetary purchase for each user.
Fval (Frequency): This is the number of items that a customer has purchased in customer lifetime, which is the purchaseCount in the above table.
Mval (Monetary): The total purchase value during the entire customer life time, which is the totalPurchaseAmount.
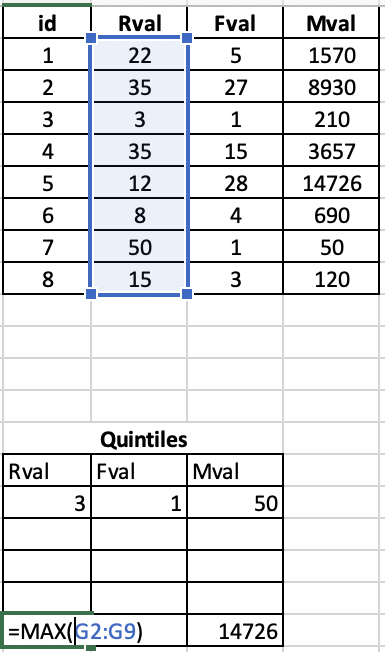
Step 3: Build Quintile Grid
A quintile is a percentile but divided into exactly 5 parts. To get the Quintile Grid, use the MIN() and MAX() functions in excel to get the first and last quintile values of columns Rval,Fval and Mval.
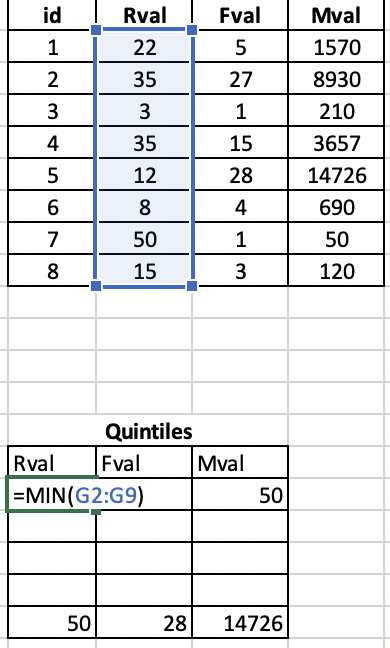
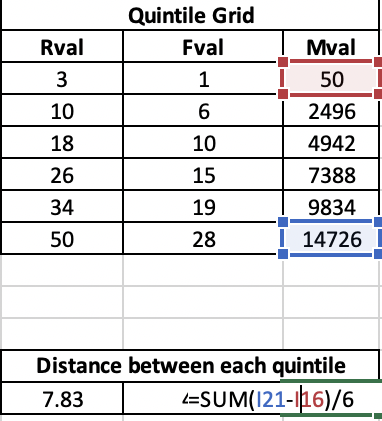
Now to fill up the distance between each quintile, let’s subtract the max value from the min value and divide by 6 (Why 6? So we get 5 distinct mid/between points a.k.a.value ranges).
Then add it with each consecutive row value to get the next quintile for each column.
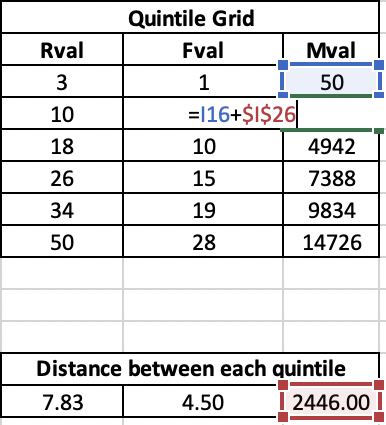
After which we now have our Quintile grid.
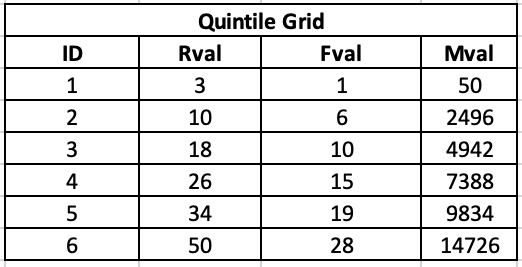
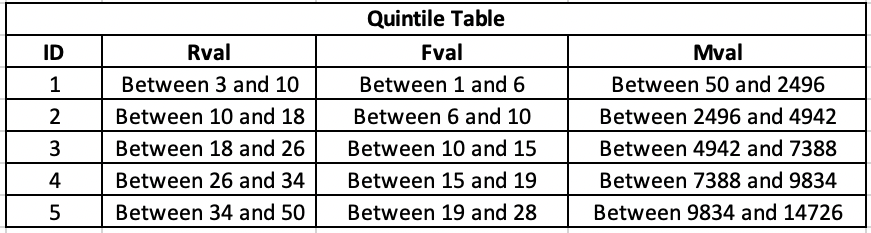
Step 4: Build Quintile Table from the Quintile Grid
Refer the values from the Quintile grid to get a range.You are going to use this in the next step to get the RFM scores.
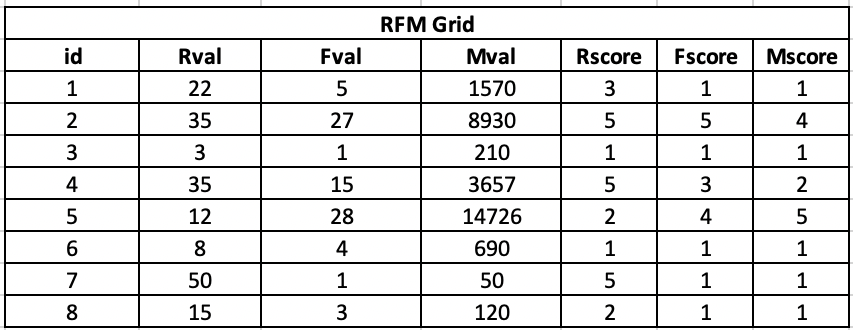
Step 5: Build RFM Table
Let’s add 3 columns to the earlier table and calculate scores for R,F,M values. Using your quintile grid, now calculate your RFM scores based on which quintile your value falls into. E.g: If R-val is 28, it falls into the 4th bucket of your Quintile Table.
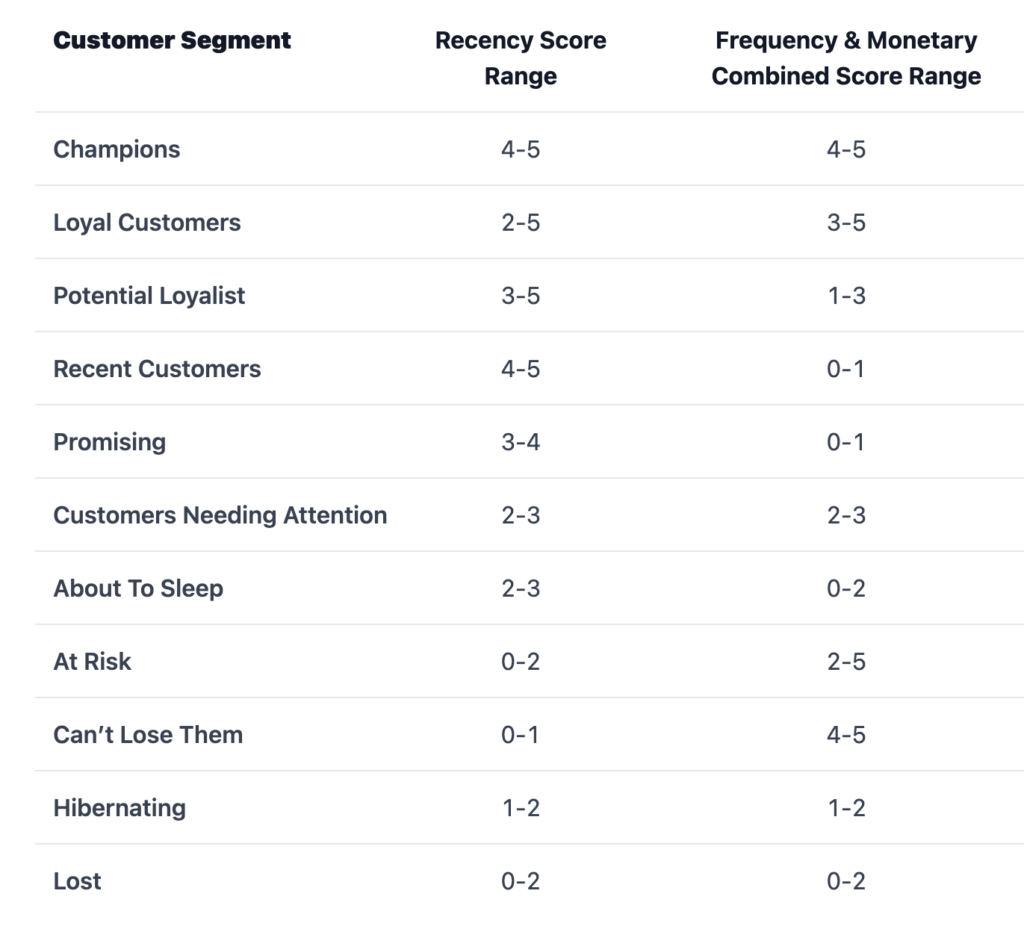
Step 6: Customer Segmentation Rules
You can now refer to this table when you want to segment your customers which explains how to categorize customers into 11 different customer segments based on their behaviour.
Step 7: Pure Javascript based Customer Segmentation
A lot of people like to use rules engines like Drools or Gandalf to apply the segment mapping to all user data. Since we won’t be using any external tools except Excel, we will be doing it the old school way a.k.a pure javascript, where you can enter your user data in JSON and the tool will spit out a Treemap chart.
If you managed to reach the end of this page, pat yourself on the back. You did it! You can apply the same to your production data as well and get terrific results. The best part of doing this yourself is that you will be able to optimize the segment rules or add more segments that you feel are required for your product business.
You can further read Best Tips to become JIRA master and impress your boss to take the starting steps towards learning JIRA. You can also read What starting a game development company taught me, which I wrote while asking myself ‘so what did you learn from that experience?’ As it turns out, quite a lot.
Leave a Reply